This project uses the Twitter Entity Sentiment Analysis dataset. It consists of two files:
twitter_training.csv: Main training dataset
twitter_validation.csv: Validation dataset
Each row contains: - an ID - a target entity - the sentiment label: Positive, Neutral, Negative, or Irrelevant - a tweet
The task is to predict the sentiment expressed toward the entity.
2.2 Sample Records (Training Set)
We display a few sample records from the training set to get a sense of what the tweets and associated sentiment labels look like. This is helpful for qualitative understanding of the input data before preprocessing.
Code
import pandas as pd# Define column namescol_names = ["id", "entity", "sentiment", "tweet"]# Load CSVs with no header rowtrain = pd.read_csv("data/twitter_training.csv", header=None, names=col_names)valid = pd.read_csv("data/twitter_validation.csv", header=None, names=col_names)train.sample(5)[["tweet", "entity", "sentiment"]]
tweet
entity
sentiment
35197
It seems like a lot of the higher influencers ...
Microsoft
Positive
12070
Just trying to the spread love
NBA2K
Positive
9030
@CODLeague when I watch the NFL I dont see NBA...
Overwatch
Negative
50037
Great performances from @loucollsport learners...
FIFA
Irrelevant
37016
His playing day for Microsoft and... 7 years i...
Microsoft
Positive
2.3 Data Cleaning
The dataset is used to train and evaluate sentiment classification models.
2.3.1 Delete Missing Data
In this step, we remove rows with missing or empty tweet texts to ensure clean inputs for training. Below is the number of missing data in each feature.
Code
# Remove rows with missing or empty tweetsprint(train.isnull().sum())train = train.dropna(subset=["tweet"])train = train[train["tweet"].str.strip().astype(bool)]
id             0
entity         0
sentiment      0
tweet        686
dtype: int64
2.3.2 Delete Missing Emoji
In this step, we remove emojis from tweets to clean the text and ensure consistent tokenization for vectorization. Here is the examples:
Code
import emoji# Define cleaning functiondef clean_text(text): no_emoji = emoji.replace_emoji(text, replace='')return no_emoji.encode("utf-8", "ignore").decode("utf-8", "ignore")# Apply to training settrain["tweet"] = train["tweet"].apply(clean_text)#ourexamplesamples = ["I'm so happy today! 😄🎉","Great job! 💯🔥","This is weird... 🤔🙃","Just finished my code 🐍💻"]max_len =max(len(s) for s in samples)for s in samples: cleaned = clean_text(s)print(f"{s.ljust(max_len)} → {cleaned}")
I'm so happy today! 😄🎉    →  I'm so happy today!
Great job! 💯🔥             →  Great job!
This is weird... 🤔🙃       →  This is weird...
Just finished my code 🐍💻  →  Just finished my code
2.4 Basic Statistics
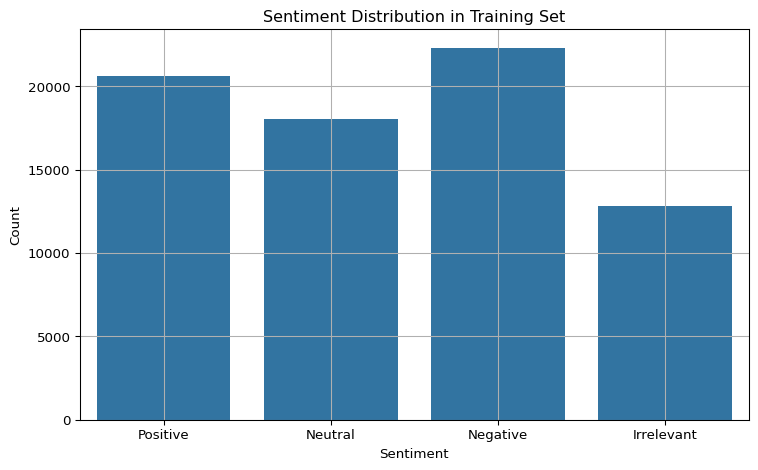
We explore the basic statistics of the dataset, including class distributions and dataset sizes. This helps us understand potential class imbalance and verify the dataset was loaded correctly.
We explore the basic statistics of the dataset, including class distributions and dataset sizes. This helps us understand potential class imbalance and verify the dataset was loaded correctly.
Based on the distribution of sentiment labels, we did not observe a significant class imbalance in the dataset.
2.5 Sentiment Distribution (Bar-Chart)
Code
import seaborn as snsimport matplotlib.pyplot as pltplt.figure(figsize=(8, 5))sns.countplot(data=train, x="sentiment")plt.title("Sentiment Distribution in Training Set")plt.xlabel("Sentiment")plt.ylabel("Count")plt.grid(True)plt.tight_layout()plt.show()